26
1
27
1
28
1
How Windmills Work (64.media.tumblr.com)
29
1
30
1
31
1
32
1
33
1
34
1

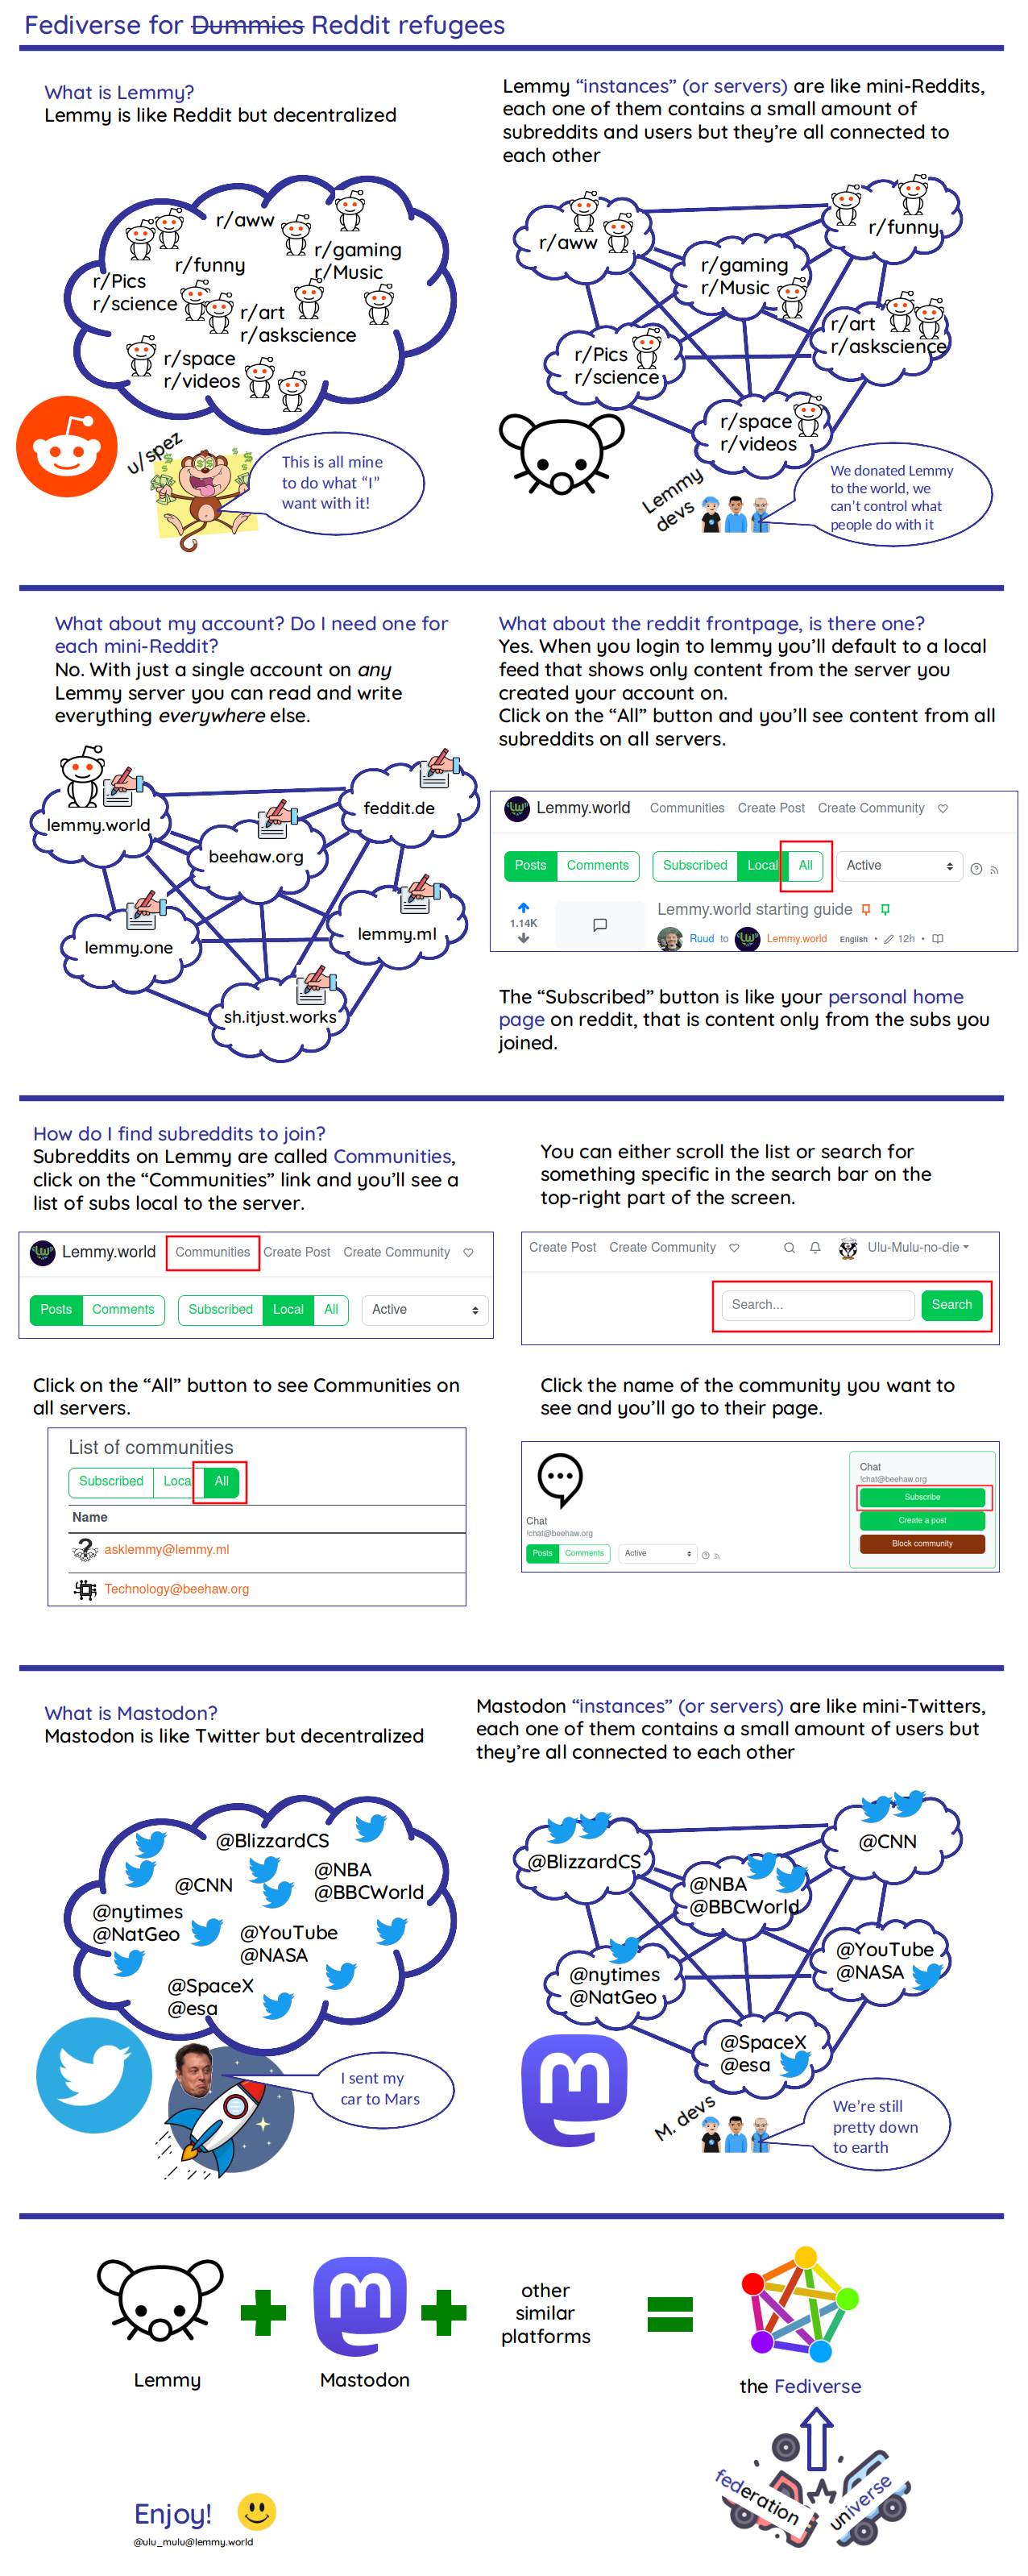
The fediverse can be confusing. Hopefully this infographic, courtesy of the lemmy.world instance, can provide some clarity.

35
1

Twenty of the 25 cities with the best work-life balance fall in Europe. The diverse range of cultures and lifestyles in these cities offers its residents a balance between work and personal life. The top city on this list, with a work-life balance score of 70.5/100, is Copenhagen, Denmark. The city’s high standard of living, low unemployment rate, 52-week-long parental leave, and focus on sustainability and green spaces all contribute to the city’s top score. It also helps that the Danish lifestyle focuses on taking time for self-care and relaxation. Healthy lifestyles along with generous vacation and parental leave policies also placed the European cities of Helsinki, Stockholm, and Oslo in the top five in this list. In fact, the average employee work week in these cities falls below 30 hours. The proportion of remote jobs in Helsinki, Finland is over 50%. Many companies in Europe prioritize employee well-being, which has led to the emergence of a wellness culture. This culture includes practices such as remote work and mental health support.

Ranked: The Cities with the Best Work-Life Balance in the World

36
1
submitted 1 year ago* (last edited 1 year ago) by maiion@chat.maiion.com to c/infographics@chat.maiion.com

What are carbohydrates? These are the macronutrients that are available in many foods and drinks. Carbohydrates are sugar divided into main 2 type’s simple carbs and complex carbs. Simpler carbs generally known as sugars and complex carbs serve as energy stores. Our body breaks down carbohydrates into glucose which is the main source of energy for our body’s cells. Glucose is the only source of energy for the brain, hence it is essential to learn whether to eat high carbohydrate foods or low carbs food and in what concentration.

Source: Good Carbs vs Bad Carbs: Which carbs are good for weight loss

c/Infographics

0 readers
1 users here now

Seeing data visualized into various graphs and graphics helps us gain perspectives on certain topics. If you have one you would like to share, please feel free to add them here!


Please Observe Instance Rules:

  1. Do not violate any laws, third-party rights, and/or proprietary rights.
  2. Do not harass others, be abusive, threatening, and/or harmful.
  3. Do not be needlessly defamatory and/or intentionally misleading.
  4. Do not upload without marking obscene and/or sensitive content as such.
  5. Do not promote racism, bigotry, hatred, harm, and violence of any kind.

founded 1 year ago
MODERATORS