this post was submitted on 27 Mar 2025
137 points (98.6% liked)
Canada
9336 readers
2069 users here now
What's going on Canada?
Related Communities
🍁 Meta
🗺️ Provinces / Territories
- Alberta
- British Columbia
- Manitoba
- New Brunswick
- Newfoundland and Labrador
- Northwest Territories
- Nova Scotia
- Nunavut
- Ontario
- Prince Edward Island
- Quebec
- Saskatchewan
- Yukon
🏙️ Cities / Local Communities
- Calgary (AB)
- Comox Valley (BC)
- Edmonton (AB)
- Greater Sudbury (ON)
- Guelph (ON)
- Halifax (NS)
- Hamilton (ON)
- Kootenays (BC)
- London (ON)
- Mississauga (ON)
- Montreal (QC)
- Nanaimo (BC)
- Oceanside (BC)
- Ottawa (ON)
- Port Alberni (BC)
- Regina (SK)
- Saskatoon (SK)
- Thunder Bay (ON)
- Toronto (ON)
- Vancouver (BC)
- Vancouver Island (BC)
- Victoria (BC)
- Waterloo (ON)
- Windsor (ON)
- Winnipeg (MB)
Sorted alphabetically by city name.
🏒 Sports
Hockey
- Main: c/Hockey
- Calgary Flames
- Edmonton Oilers
- Montréal Canadiens
- Ottawa Senators
- Toronto Maple Leafs
- Vancouver Canucks
- Winnipeg Jets
Football (NFL): incomplete
Football (CFL): incomplete
Baseball
Basketball
Soccer
- Main: /c/CanadaSoccer
- Toronto FC
💻 Schools / Universities
- BC | UBC (U of British Columbia)
- BC | SFU (Simon Fraser U)
- BC | VIU (Vancouver Island U)
- BC | TWU (Trinity Western U)
- ON | UofT (U of Toronto)
- ON | UWO (U of Western Ontario)
- ON | UWaterloo (U of Waterloo)
- ON | UofG (U of Guelph)
- ON | OTU (Ontario Tech U)
- QC | McGill (McGill U)
Sorted by province, then by total full-time enrolment.
💵 Finance, Shopping, Sales
- Personal Finance Canada
- BAPCSalesCanada
- Canadian Investor
- Buy Canadian
- Quebec Finance
- Churning Canada
🗣️ Politics
- General:
- Federal Parties (alphabetical):
- By Province (alphabetical):
🍁 Social / Culture
- Ask a Canadian
- Bières Québec
- Canada Francais
- First Nations
- First Nations Languages
- Indigenous
- Inuit
- Logiciels libres au Québec
Rules
- Keep the original title when submitting an article. You can put your own commentary in the body of the post or in the comment section.
Reminder that the rules for lemmy.ca also apply here. See the sidebar on the homepage: lemmy.ca
founded 4 years ago
MODERATORS
you are viewing a single comment's thread
view the rest of the comments
view the rest of the comments
The funny part about this is that I feel even more validated when I check a live updates graph of the s and p 500.
See for yourself: https://www.macrotrends.net/2488/sp500-10-year-daily-chart
The way I interpret that graph of the last 5 years is that at only a couple of points in time did any drops as steep or as large occur except during covid times (exacerbated hugely by Trump) and once in 2023 which I'm not sure what happened but it was a slower fall and the recovery was very strong.
Then funny enough I stumbled on this image (I had saved from a couple weeks ago) when I took this screenshot to show you: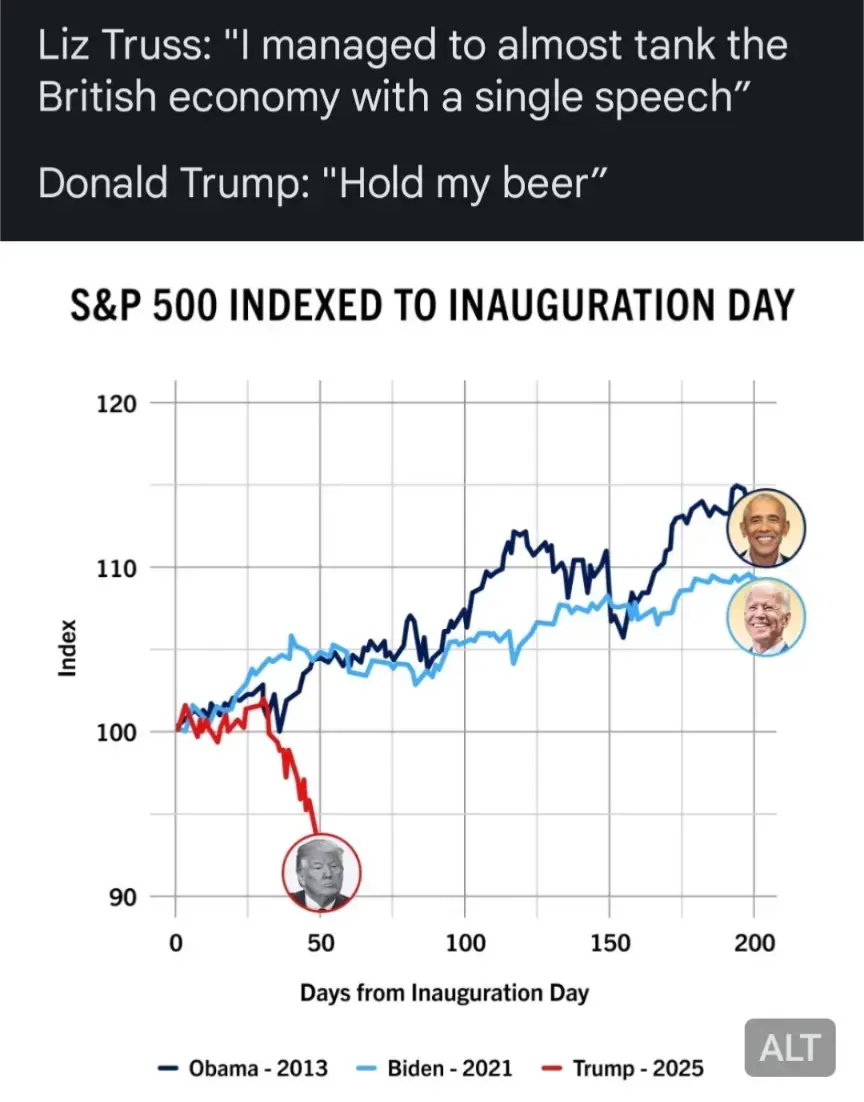
I don't find it fair to say it only is significant because it's not visible on a 90 year graph. Times change a lot over decades. Even if you only look at 20 years back, this is a blip you can see and it's only a couple months in.
https://www.macrotrends.net/2324/sp-500-historical-chart-data
If you look at this data and don't see it, I don't know what to tell you.