329
Comparison of population, wage, and home price growth
(sh.itjust.works)
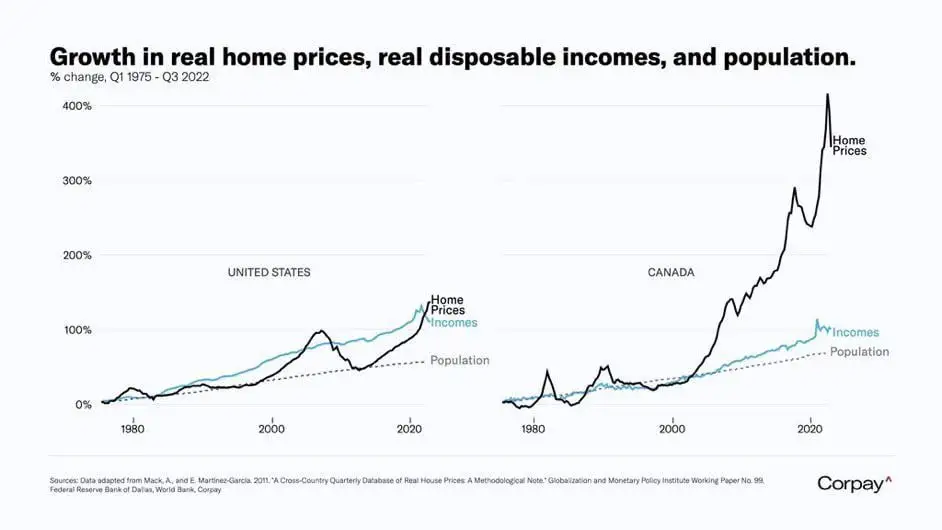
That graph is insane
cries in Canadian
This is definitely an average. Top earners dragging up the average makes it a shit number to use in most economical statistics. Median is better for income figures almost always these days.
Still shocking that Canada is this much worse than the US. It's also horrible here.
Yes, my takeaway here is that the wealth gap in Canada is not as bad as in the USA (assuming that the median income barely increased in both countries)
This graph is so location dependent for the US. Where I am, home prices have gone up well over 10x since 1980. There are many places in the US where it is just as bad, or even worse than the average in Canada.
The issue in Canada is also location dependent, some areas 10x plus others not. But even worse is that housing across the board has gone up as people flee the high price areas, bringing demand to the cheaper areas, and therefor raising the prices.
There are a few areas that have become so impossible to afford (Canmore, Banff, Vancouver etc.) that the lower earning workers are living in tents (this also happens in the states but is new there I hear).
Yeah my home town that's a little over an hour outside of a city has small houses selling for half a million (CAD) now. I don't even know how anyone from the town would afford that on their retail or factory work income
I hate it when the chart doesn't say what it depicts. I assume those are averages, not median. The average hides that fact that most people's real income has barely grown in 20 years. All the income growth comes from the top 20% or so, you don't see that in the average.
Recently saw the house Taylor Swift grew up in. Amazing mansion that would cost $2M in Canada or the Netherlands.
But it sold in 2022 in the USA for $800K.
The higher interest rates and property taxes keep the price of US homes a bit more reasonable than in Canada or the Netherlands.
And (as I understand) those are deductible for the income tax in the US, so working people have a tax advantage that investors don't have.
In any case, taxing property and lowering income tax seems like it would help working people afford homes relative to investors. It seems like a politically good move, too.
Eh, at least in my experience, interest in most normal mortgages ends up less than the standard deduction so it can't be claimed. It was a change Trump made to the tax code I think. I don't understand enough about it to know if it affects me negatively or not. I know it's better for me to claim the standard deduction instead of itemizing my deductions. This means I can't claim interest paid (which is bad), but the standard deduction is higher than it was before, so I think I'm still claiming more money as untaxable (which is good, I think?).
Maybe someone with more knowledge than me can chip in.
Trump limited SALT deductions, which includes property taxes and state sales and income tax, while doubling the standard deduction. For most people living in high cost areas, especially those in states with an income tax, they would still be able to itemize for more than the doubled standard deduction, but now they can't because of the new limits. (Most) homeowners in high cost states are paying more federal income tax now because of Trump's changes to the tax code.
The standard deduction existed prior to Trump and changes every year, but I'm not sure exactly how it's determined. Under Trump, it was effectively doubled from what it was previously. You can view a historic chart on this Wikipedia page.
Your good/bad assessment is overly simplistic, but essentially correct. In your example, you CAN claim your mortgage interest, OR choose the standard deduction - But in YOUR situation you benefit MORE from the standard deduction.
With a larger standard deduction, those with 'simpler' financial situations benefit from a lowered taxable income amount, without having to do the complex bits of documenting/justifying deductions they claim. - And without the risk of a potential audit.
For example, someone who DOESN'T own their home or have expenses they could deduct, still get their income reduced by that standard amount.
High-complexity situations (rich people) don't benefit from it, and still are required to document and justify their deductions line-by-line.
The US tax system is overly complex and burdensome, but a higher standard deduction is, at least from my understanding, a benefit to the less fortunate that the more well-off don't also benefit from.
I couldn't tell you what income level represents the 'split' between those who benefit from it and those who don't. It has less to do with income and more to do with your broader situation - Mortgage amounts, expenses, etc.
Did they stop making houses in Canada?
If I recall correctly, there is a ton of foreign money buying up all the housing in Canada, which drives up pricing.
It's just money in general. Not every province tracks foreign ownership of residential housing, but those that do show only about 5% of houses are owned by foreigners. It's mostly rich Canadians and Canadian businesses that have purchased a huge amount of housing as a form of market speculation.
However, houses being worth a small fortune is good for anyone who already owns a house, which is most Canadians. The issue is that not everyone wants house prices to drop.

Does that include businesses that are registered in Canada but primarily held by foreigners?
I'll never understand why people think "only" 6.2% of a consumer base can't heavily distort a market based on benchmarks.
We all forgetting about NFTs and Crypto?
This is one of many pieces of the puzzle. There are also terrible zoning laws preventing density in cities. Also, to be clear, immigration is essential to our country and we have a responsibility as a wealthy western to country to accept refugees. However, we have been increasing our immigration rates a ton and our new builds has been really low. Many of these new Canadians are sold a false promise.
Housing is a main factor to Canada's GDP which is scary, so the government is propping it up.
Dataisterrifying
This graph would look much different if it compared home prices in 2022-2023.
What do you mean
Home in the US shot up in price around the end of 2021 and peaked earlier this year. I wonder how the comparison looks after that spike.
This is what a bubble looks like.
This is what a government enabled bubble looks like that has no interest in "solving" the issue.
This was the slowest moving train wreck I can think of.
With inflating house prices contributing to GDP figures, how much interest do you think the government will have in tanking the market to take from the haves and give it to the have nots?
As with any essential good/service (looking at you, US healthcare) commodiying housing was a catastrophic mistake. The essential nature of it inevitably creates market failure - the consequences of which are plain to see in that graph.
Someone better at such things than me needs to add a trendline for the ratio of median employee to median CEO earnings for publicly traded companies over the same period of time. Maybe it wouldn't look like I think it would - but maybe it would.
wot dey doin ova der?
Interesting how 2008 dramatically reduced prices in the US but basically did nothing in Canada
New Zealand says hello.
So, are we screwed?
How does this fit with purchased by non Canadian born people?
Yeah, but that goes for and bubble that has roots in some sort of legislation. The tech bubble is probably most recent that wasn't government related.
Does anyone else see this post with -1 downvotes?
A place to share and discuss data visualizations. #dataviz
(under new moderation as of 2024-01, please let me know if there are any changes you want to see!)